We built a live visitor dashboard for three Colorado businesses in 24 hours
On November 2 and 3, 2026 we put a live website-visitor dashboard in front of three Colorado businesses. The first one started at 1:56 PM on November 2. The third went live at 3:26 AM the next morning. Each owner now opens one page and sees who came to their website, where they came from, and what they did, refreshed every 10 minutes.
The three businesses
| Business | Where the dashboard lives | What is special about theirs |
|---|---|---|
| AD's Construction, Denver home remodeling | A Visitors tab inside the dashboard they already use | Form leads and a call log next to the website numbers |
| SB Tax, tax and bookkeeping in Aurora | Its own page on their website, with its own login | Calls answered by their AI phone line, each with a written summary, and the text conversations that followed |
| 3 Thirsty Goats, wine and liquor in Colorado Springs | Its own page on their website, with its own login | Sign-ups for the bourbon list and party quotes, follow-up texts, and visitors split by channel |
Each dashboard reads only its own business's data. Before anything is installed, a check compares every setting against every other client and refuses to run on any match.
What the dashboard shows
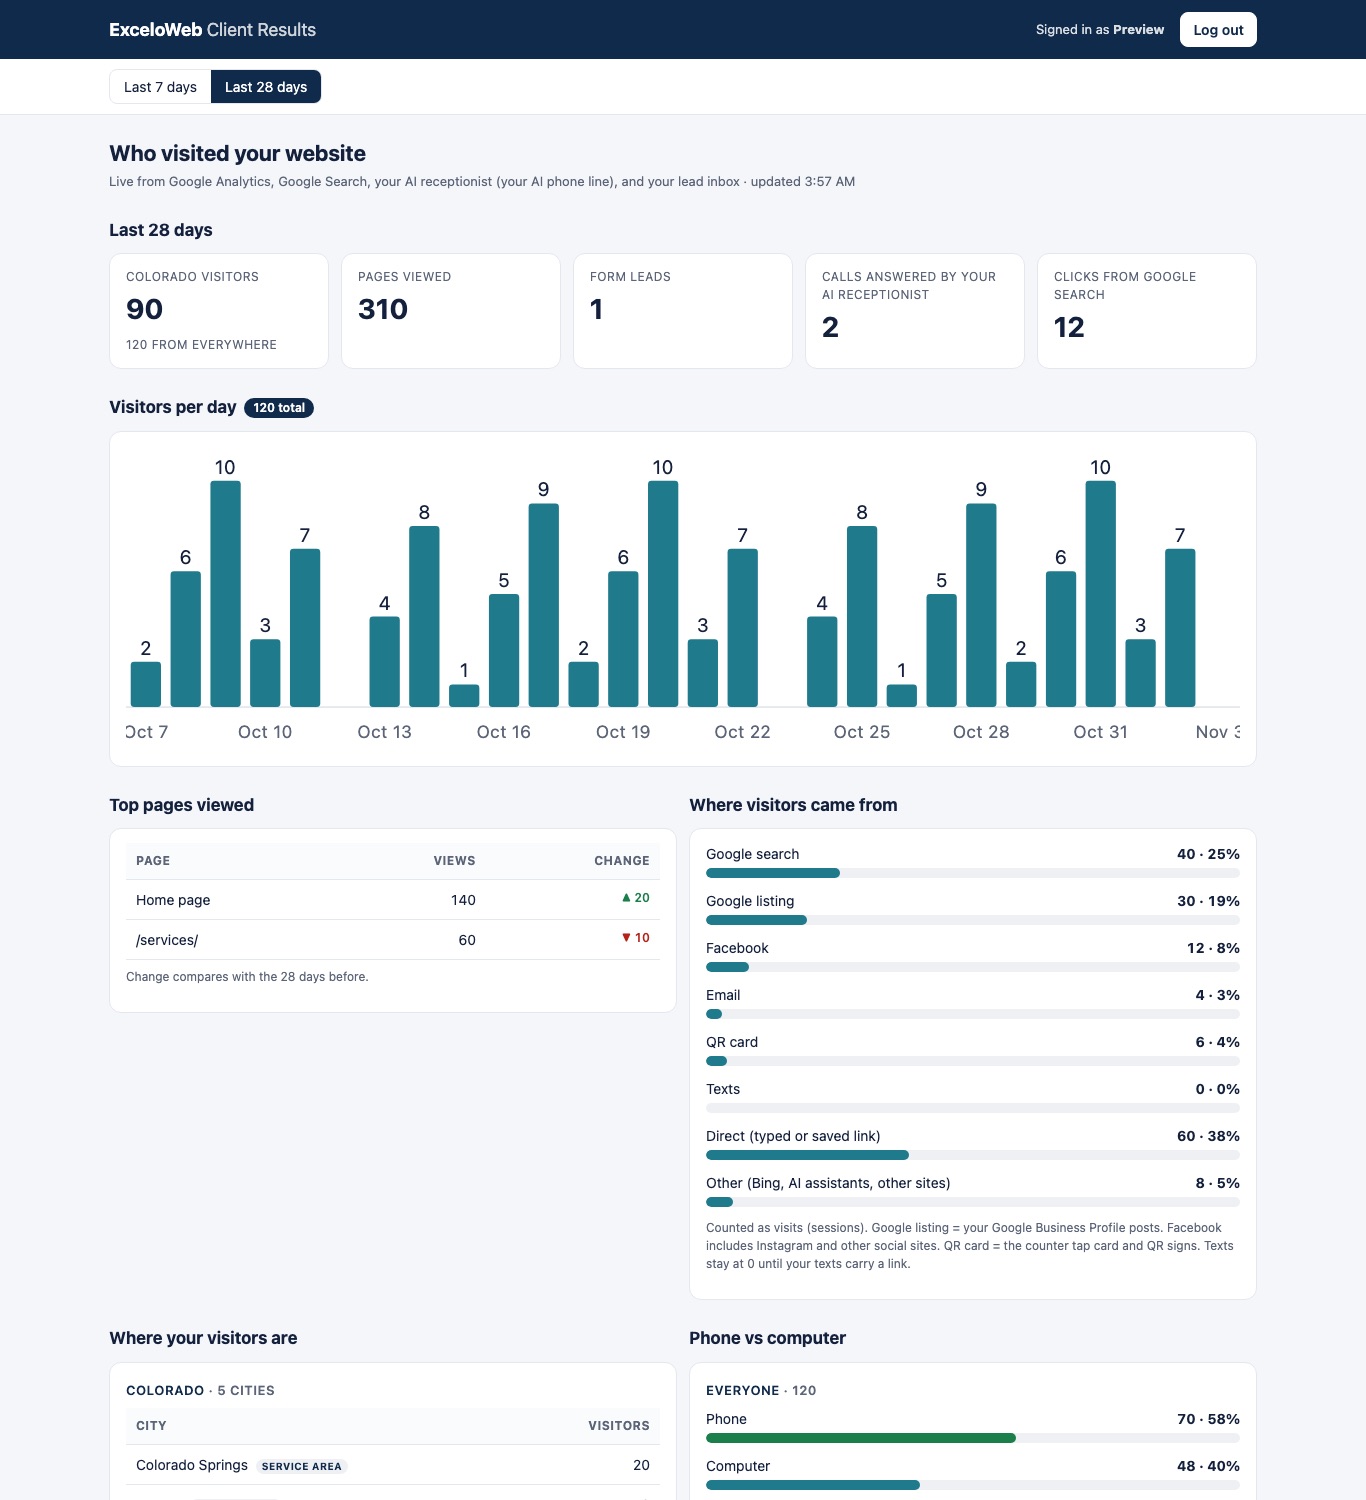
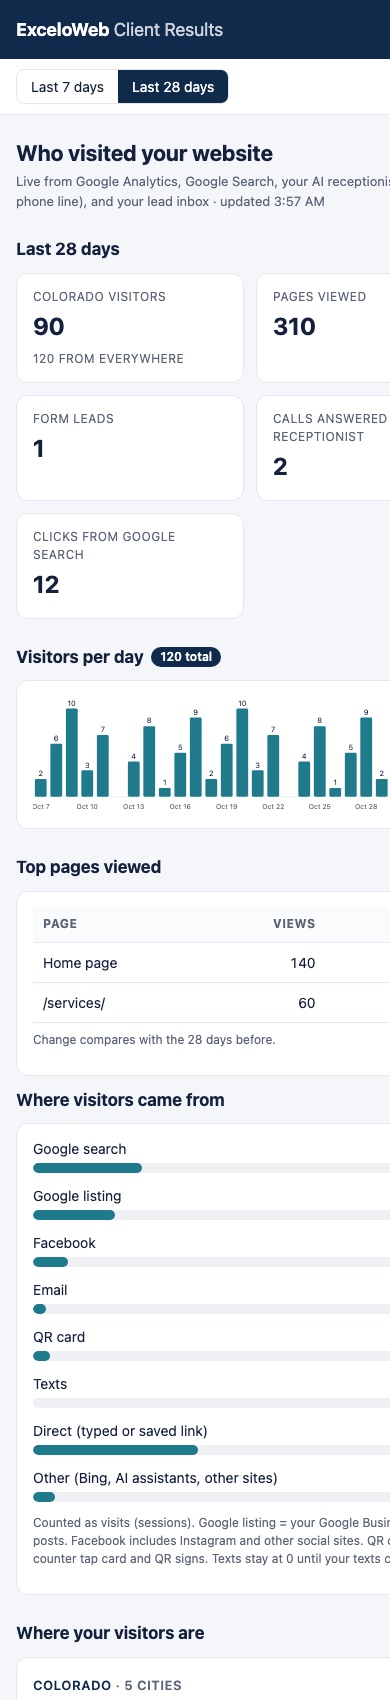
- Visitors per day for the last 7 or 28 days, and the pages they viewed, with the change from the period before.
- Where visitors came from: Google search, the Google Business Profile listing, Facebook, email, the QR card at the counter, texts, direct and other. On the newest build, the links we post for the business are tagged so each channel is counted on its own.
- Which cities they are in, with the business's own service area marked.
- Phone or computer, for everyone and for local visitors only.
- Taps on the call and text buttons.
- Leads from the website forms, with test submissions left out.
- Calls answered by the AI phone line, where the business has one, with what the caller needed.
- What people searched on Google before they found the site, grouped by the service they were looking for.
What we found: most of one store's visitors were not people
When the store's dashboard first loaded, Google Analytics reported 2,107 visitors in 28 days. That looks like a busy website for one shop. Then we looked at where they were.
55
Only 55 of those visitors were in Colorado, the store's whole market. 1,083 came from Singapore. 1,990 of the 2,107 were on a desktop computer, while 47 of the 55 Colorado visitors were on a phone, which is how real local shoppers look up a store.
So the dashboard now leads with visitors in the business's own state, with the total from everywhere shown underneath, and it counts only visitors who actually opened a page. An owner who sees 2,107 thinks the website is doing its job. An owner who sees 55 knows what to fix.
How it is put together
The numbers come straight from the business's own Google Analytics, Google Search Console, lead inbox and phone line. Nothing is typed in by hand. The page has its own sign-in and is never shown to search engines. A new business gets the same dashboard from one settings file, checked before it goes live.
Get this dashboard for your business
From $150 per month, plus a small fee for each real lead your dashboard logs. No long contract.
Call (720) 239-1544 or get our card.
Call (720) 239-1544